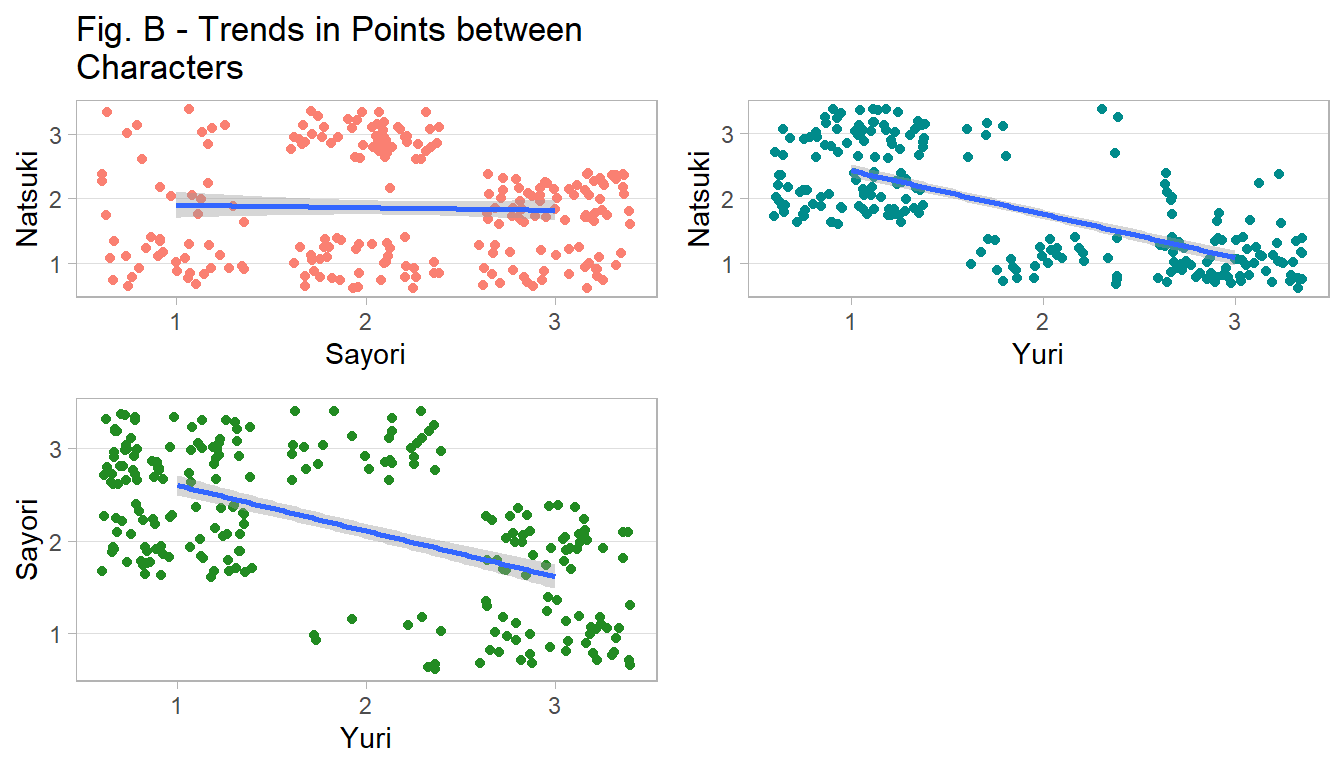
g1 <- ggplot(data) +
  aes(y = Natsuki, x = Sayori) +
  geom_jitter(col = 'salmon') +
  geom_smooth(method = 'lm') +
  labs(title = 'Fig. B - Trends in Points between
Characters') +
  theme_light2()

g2 <- ggplot(data) +
  aes(y = Natsuki, x = Yuri) +
  geom_jitter(col = 'cyan4') +
  geom_smooth(method = 'lm') +
  labs(title = '\n') +
  theme_light2()

g3 <- ggplot(data) +
  aes(y = Sayori, x = Yuri) +
  geom_jitter(col = 'forestgreen') +
  geom_smooth(method = 'lm') +
  theme_light2()

grid.arrange(g1, g2, g3, nrow = 2, ncol = 2, newpage = FALSE)